

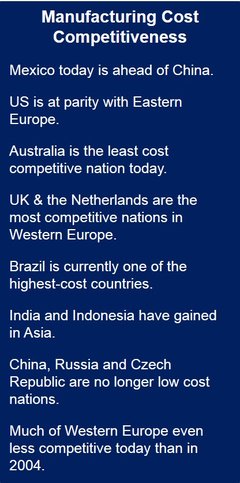
Mexico and the US are the rising stars in global manufacturing cost competitiveness, according to research by The Boston Consulting Group (BCG). The overall manufacturing-cost structures of the US and Mexico have improved considerably relative to almost all other major exporting nations.
Manufacturing cost competitiveness worldwide has changed significantly over the last ten years – so considerably that several of the old perceptions of low-cost and high-cost countries are no longer relevant, the report authors say.
Brazil today is one of the highest-cost countries as far as manufacturing is concerned, while the United Kingdom is the cheapest country in Western Europe.
Mexico more cost competitive than China today
Mexico currently fares better than China as far as manufacturing cost competitiveness is concerned, while most of the Eastern European nations are basically at a parity with the United States.
Manufacturing cost competitiveness is becoming progressively more important as companies and organizations globally reconsider their manufacturing network and as governments recognize how important a stable manufacturing base is.
The Boston Consulting Group has developed the BCG’s Global Manufacturing Cost-Competitiveness Index, which monitors changes in production costs over the last ten years in the twenty-five largest goods-exporting countries.
The Index incorporates four direct drivers of manufacturing competitiveness:
- Wages.
- Productivity growth.
- Energy costs.
- Currency exchange rates.
These twenty-five nations make up almost 90% of worldwide exports of manufactured goods.
Asia, North America & Eastern Europe most competitive
Among the ten countries with the lowest manufacturing costs, according to the Index, six are in Asia, and rest are located in North America and Eastern Europe.
Some countries have slipped sharply in manufacturing cost competitiveness. Australia, for example, now has the highest manufacturing cost structure, approximately 30% higher than the US.
Harold L. Sirkin, a BCG senior partner and a coauthor of the analysis, said:
“Many companies are making manufacturing investment decisions on the basis of a decades-old worldview that is sorely out of date. They still see North America and western Europe as high cost and Latin America, eastern Europe, and most of Asia – especially China – as low cost. In reality, there are now high- and low-cost countries in nearly every region of the world.”
Among the 25 top exporting nations, the study identified four distinct patterns of change in manufacturing cost competitiveness over the last ten years:
Countries under pressure
Russia, China, Brazil, the Czech Republic and Poland, countries traditionally considered as low-cost manufacturing bases, have slipped considerably since 2004.
Their erosion has been caused by a combination of:
- Steep wage increases.
- Poor productivity growth.
- Appreciation in the value of their currencies.
- A significant rise in energy costs.
China, which in 2004 had a giant manufacturing-cost advantage over the US, has seen it shrink to just 5%. Costs in Eastern Europe are either on a par with the US or even higher.
Countries losing ground
A number of nations that were already considered relatively expensive in 2004, mainly in Western Europe, have slipped even further behind. Below is a list of countries with their manufacturing cost increases compared to the US over the past decade:
- Belgium – 6%.
- Sweden – 7%.
- France – 9%.
- Switzerland – 10%.
- Italy – 10%.
The main contributors to their slide are low productivity growth (or even declines) and higher energy costs.
Countries holding steady
Some countries have held their manufacturing costs constant in relation to the United States over the past decade, while gaining competitiveness within their regions. A combination of productivity growth and currency declines have helped offset pay increases and helped keep India and Indonesia in check.
The Netherlands and the United Kingdom have seen steady productivity growth and have gained ground in the region.
Consequently, cost structures in India and Indonesia have improved relative to the other major exporters in Asia, while the Netherlands and UK have gained competitively in relation to exporters throughout Europe.
Rising star nations
Mexico and the United States have seen considerable improvements in their overall manufacturing-cost structures compared to the other major exporting nations around the world. The main drivers of their improvement were:
- Steady exchange rates.
- A huge energy-cost advantage, brought about by a 50% fall in natural-gas prices since the US started large-scale shale gas production in 2005.
- Sustained productivity improvements.
While Mexico today can boast lower average manufacturing costs than China, the US’ overall costs are between 10% and 25% lower than those of the top ten good-exporting nations globally (excluding China).
Michael Zinser, a BCG partner who is coleader of the firm’s Manufacturing practice, said:
“While labor and energy costs aren’t the only factors that influence corporate decisions on where to locate manufacturing, these striking changes represent a significant shift in the economics of global manufacturing. These changes should drive companies to rethink their sourcing strategies, as well as where to build future capacity. Many will opt to manufacture in competitive countries closer to where goods are consumed.”
Findings have implications for public and private sectors
The report’s findings have implication for both governments and companies as they consider current and future manufacturing options. Several economies that have lost ground over the past decade risk losing even more if their pay and productivity trends persist.
In some countries with low direct-manufacturing costs, the authors found that competitiveness could be hindered by other factors, including a hostile business environment or poor logistical infrastructure.
Co-author and BCG partner, Justin Rose, said:
“With a better understanding of where rising costs and other factors are putting their manufacturers at a disadvantage, countries can take more effective action to shore up competitiveness.”
Companies should reassess their worldwide production and sourcing footprints, the authors emphasize, in light of today’s cost structures and trends. Manufacturers need to take into account total costs and look beyond wages. Differences in productivity and hidden costs also matter.
Rose, Zinser and Sirkin said:
“When companies build new manufacturing capacity, they are typically placing bets for 25 years or more. They must carefully consider how relative cost structures have changed—and how they are likely to evolve in the future.”
